How to Read Candlestick Patterns?
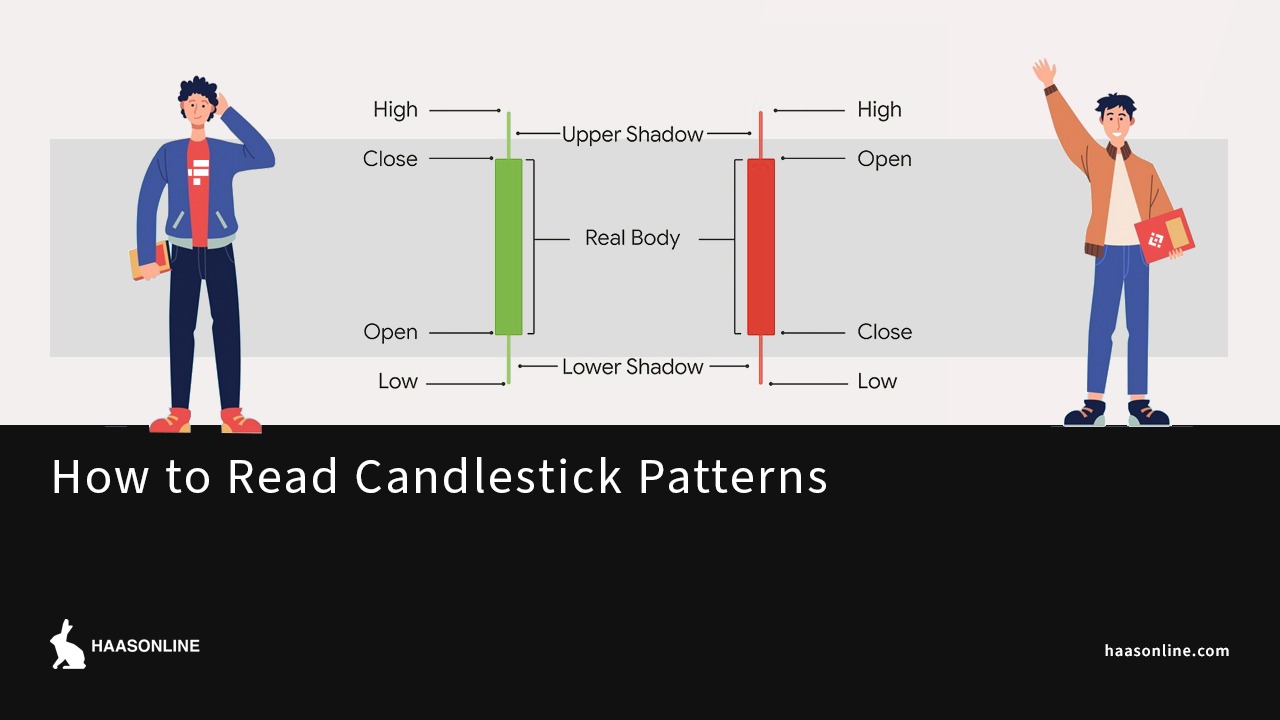
Candlestick charts are one of the most widely used tools in technical analysis, and for good reason — they pack a remarkable amount of price information into a single, easy-to-read visual format. Each candlestick represents the price action for a defined time period, whether that's one minute, one hour, or one day. The body of the candle shows the range between the opening and closing price, while the thin lines extending above and below — called wicks or shadows — show the highest and lowest prices reached during that period. A green or white candle indicates the price closed higher than it opened (bullish), while a red or black candle means the price closed lower (bearish).
Learning to read individual candlestick shapes is the foundation of this analysis technique. A long-bodied candle with short wicks indicates strong conviction from buyers or sellers, meaning price moved decisively in one direction with little resistance. Conversely, a candle with a very small body and long wicks — often called a doji or spinning top — signals indecision in the market, where neither buyers nor sellers gained the upper hand. The hammer pattern, characterized by a small body near the top and a long lower wick, often signals a potential reversal after a downtrend, suggesting that sellers pushed price down but buyers ultimately recovered most of the losses.
Patterns formed by two or more consecutive candles carry even more analytical weight. The engulfing pattern, for instance, occurs when a candle's body completely engulfs the previous candle's body. A bullish engulfing pattern — where a large green candle follows a smaller red one — often signals that buyers have taken control and a reversal may be underway. The bearish engulfing pattern works in reverse. The morning star and evening star are three-candle patterns that indicate trend reversals at market bottoms and tops respectively, and experienced traders watch for them carefully at key support and resistance levels.
Context is everything when reading candlestick patterns. A hammer at a well-established support level carries far more significance than the same pattern appearing in the middle of a ranging market. Similarly, patterns that form on higher time frames — daily or weekly charts — tend to be more reliable than those on shorter time frames, which are more susceptible to noise. Volume provides additional confirmation: a bullish reversal pattern accompanied by above-average volume suggests genuine buying interest rather than a temporary fluctuation.
For algorithmic and automated traders, candlestick patterns are valuable inputs for strategy design. Bots can be programmed to detect specific formations and trigger trades when conditions are met, removing emotional bias from the equation. However, even automated strategies benefit from understanding the underlying logic behind each pattern — knowing why a particular formation is significant helps traders build more robust rules and avoid over-fitting to historical data. Combining candlestick analysis with indicators like RSI, moving averages, or Bollinger Bands creates a multi-layered approach that tends to produce more reliable signals than any single tool alone.