Candlestick Patterns
Explore 15 chart patterns used in technical analysis
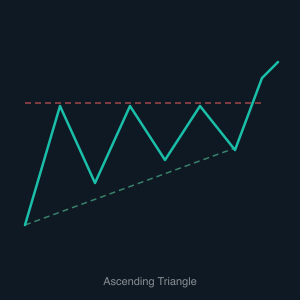
Ascending Triangle
A bullish continuation pattern defined by flat resistance and rising support, signaling that buyers are gaining strength and a breakout higher is likely.
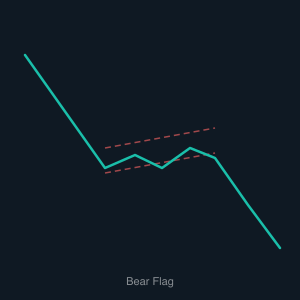
Bear Flag
A bearish continuation pattern where a steep drop is followed by a weak, parallel bounce, with a breakdown signaling a resumption of the downtrend.
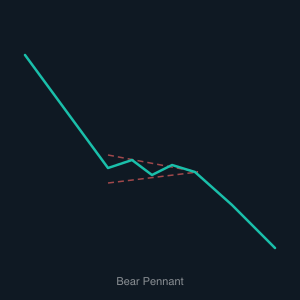
Bear Pennant
A bearish continuation pattern where a sharp decline pauses in a converging consolidation before breaking lower to extend the downtrend.
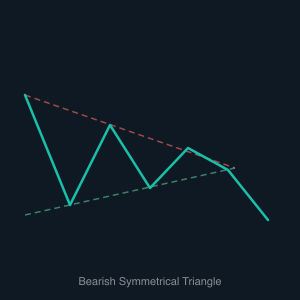
Bearish Symmetrical Triangle
A bearish continuation pattern formed by converging trendlines that, once broken to the downside, typically triggers a fast and sharp price decline.
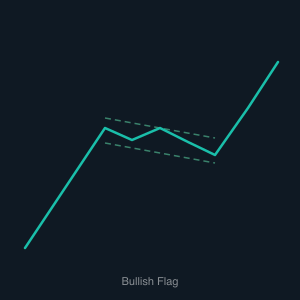
Bullish Flag
A bullish continuation pattern where a sharp rally is followed by a brief, orderly pullback, setting up a breakout to new highs.
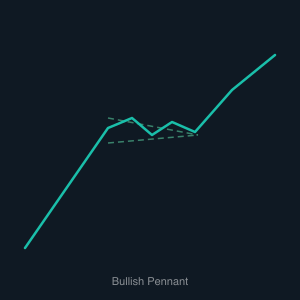
Bullish Pennant
A bullish continuation pattern where a sharp price spike is followed by a converging consolidation, with a breakout signaling the trend is resuming.
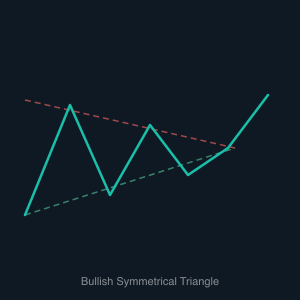
Bullish Symmetrical Triangle
A bullish continuation pattern where converging trendlines signal a period of consolidation before a sharp upside breakout.
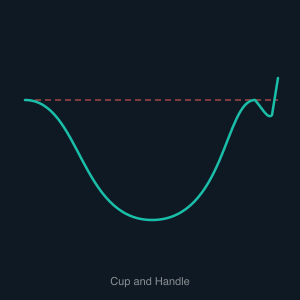
Cup & Handle
A two-part bullish pattern where a rounded bottom followed by a brief consolidation sets up a high-probability breakout to new highs.
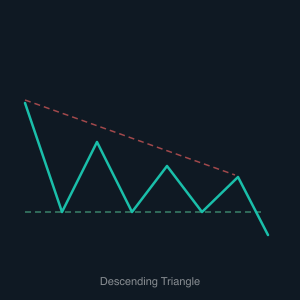
Descending Triangle
A bearish continuation pattern with flat support and declining highs, signaling that sellers are overwhelming buyers and a breakdown lower is likely.
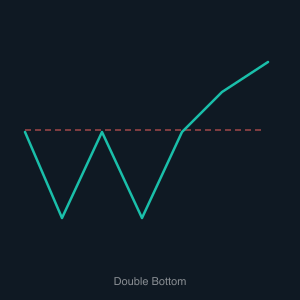
Double Bottom
A bullish reversal pattern resembling the letter W, where two tests of the same support level signal that sellers have lost control and a trend change is underway.
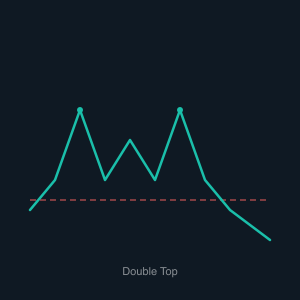
Double Top
A bearish reversal pattern where two failed attempts to break resistance signal exhausted buying pressure and a likely shift to a downtrend.
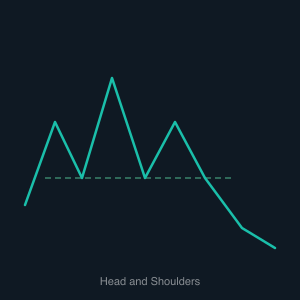
Head & Shoulders
A classic bearish reversal pattern with three peaks — the middle being the highest — signaling a shift from an uptrend to a downtrend once the neckline breaks.
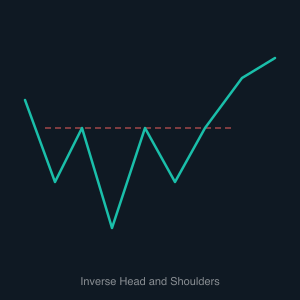
Inverse Head & Shoulders
A bullish reversal pattern with three troughs — the middle being the deepest — that signals a shift from a downtrend to an uptrend once the neckline is broken.
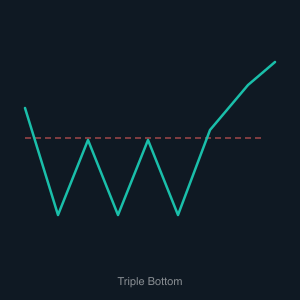
Triple Bottom
A bullish reversal pattern where three tests of the same support level signal sellers are exhausted, with a breakout above resistance confirming the trend change.
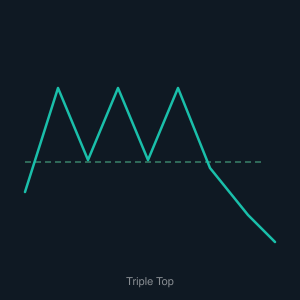
Triple Top
A bearish reversal pattern where three failed attempts to break resistance signal that buying pressure is spent and a significant decline is likely to follow.