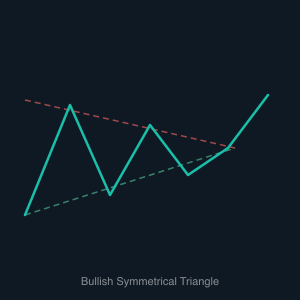
Bullish Symmetrical Triangle
The Bullish Symmetrical Triangle chart pattern is easy to spot due to its distinctive shape, which is created by two converging trendlines — a descending upper line connecting a series of lower highs, and a rising lower line connecting a series of higher lows. Together these lines form a narrowing wedge that visually compresses price action toward an apex. The pattern typically forms during a pause in an existing uptrend, representing a period of consolidation where neither buyers nor sellers have a decisive advantage. Volume tends to contract as the pattern develops, reflecting the indecision in the market.
Despite the symmetric appearance suggesting neutrality, in the context of a prior uptrend the Bullish Symmetrical Triangle most often resolves to the upside. Once price breaks above the descending upper trendline — especially on elevated volume — a sharp and swift move higher typically follows. The measured target for the breakout is calculated by taking the height of the triangle at its widest point and adding it to the breakout price. The longer the pattern takes to form, the more energy is often released when the breakout finally occurs.
Bot traders particularly appreciate this pattern because it provides precise entry and exit parameters. A trading bot can be programmed to watch for the converging structure, monitor the upper trendline as a trigger level, and execute a long trade the moment price closes above it. Tight stop-losses can be placed just below the lower trendline at the time of breakout, offering a well-defined risk-reward setup. Automated systems can also factor in volume data to filter out false breakouts before committing to a position.