Inverse Head & Shoulders
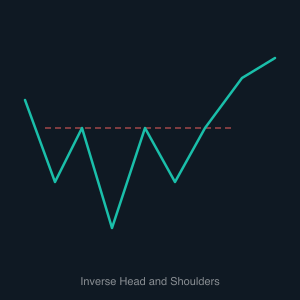
The Inverse Head & Shoulders chart pattern is the mirror image of the standard Head & Shoulders and serves as one of the most dependable bullish reversal signals in technical analysis. It forms at the bottom of a downtrend and consists of three successive troughs: a left shoulder, a deeper central trough known as the inverted head, and a right shoulder that reaches approximately the same depth as the left. A neckline is drawn connecting the two peaks formed between the troughs, and this resistance line becomes the critical level to watch. The pattern reflects a market where sellers are progressively losing their ability to push price to new lows, and buying interest is quietly building.
The bullish reversal is confirmed when price breaks above the neckline after forming the right shoulder. This breakout signals that buyers have overcome the resistance that capped prior rallies and that the downtrend is likely over. The measured upside target is determined by calculating the distance from the inverted head to the neckline and projecting that amount upward from the breakout level. Volume ideally increases on the right shoulder's rally and surges on the neckline breakout, confirming that genuine demand is driving the move rather than a low-conviction bounce.
For bot traders, the Inverse Head & Shoulders provides a clean framework for entering long positions at the early stages of a new uptrend. An automated system can detect the three-trough structure, identify the neckline resistance level, and execute a long trade on a confirmed close above it. A stop-loss placed below the right shoulder contains the risk if the breakout fails, while the measured target gives the bot a rational exit point. Like its bearish counterpart, this pattern works across all timeframes and asset classes, making it a highly versatile component of an algorithmic trading toolkit.