Descending Triangle
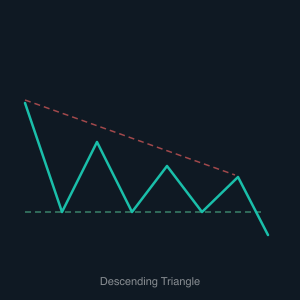
The Descending Triangle chart pattern is a bearish continuation formation that typically appears during a downtrend, signaling that sellers remain in control and the decline is likely to persist. It is defined by a flat horizontal support line connecting a series of roughly equal lows, and a descending upper trendline connecting a series of progressively lower highs. This asymmetry is significant: while buyers manage to defend the same support level repeatedly, they are unable to push price to new highs — each bounce is weaker than the last. Sellers are gradually overpowering buyers, and the market is coiling toward a breakdown.
The bearish resolution occurs when price breaks decisively below the flat support line. This breakdown releases the compressed selling pressure that had been building throughout the pattern, often resulting in a sharp and sustained move lower. The measured target is calculated by taking the height of the triangle at its widest point and projecting that distance downward from the breakdown level. Volume typically contracts during the formation and then surges on the breakdown candle, confirming that sellers have decisively won the battle for that support level.
Algorithmic traders prize the Descending Triangle for its mechanical clarity. A bot can be programmed to identify the flat support boundary and the series of lower highs, then trigger a short trade on a confirmed close below support. The upper trendline at the moment of breakdown serves as a logical stop-loss level — if price reverses back inside the triangle after a breakdown, the setup is likely invalid. The pattern's defined geometry also makes it straightforward to code a measured-move profit target, enabling bots to enter, manage, and exit the trade entirely on autopilot.