Triple Bottom
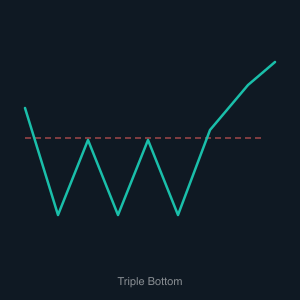
The Triple Bottom chart pattern is used as a predictor of a reversal following a prolonged downward trend. It occurs when price creates three distinct troughs at approximately the same support level, with moderate recoveries between each low that form two interim peaks. This repeated testing of the same support zone — and the market's consistent refusal to break below it — signals that sellers are exhausting their strength. Each failed attempt to push lower represents sellers giving back ground, while buyers accumulate positions at a level they collectively consider attractive. The pattern can take weeks or months to fully develop, but its eventual resolution tends to carry significant conviction.
The bullish reversal signal is triggered when price closes above the resistance level formed by the peaks between the three troughs — a line often referred to as the neckline or breakout level. This close above resistance confirms that buyers have decisively overpowered sellers and that the prior downtrend has run its course. The measured target for the upward move is calculated by taking the height from the support level to the neckline and projecting that distance above the breakout. Volume tends to increase on each of the three recoveries and should surge meaningfully on the final breakout, validating the reversal.
For algorithmic traders, the Triple Bottom is a powerful setup because the three-touch support zone creates a very well-defined and statistically significant floor. A bot can be programmed to identify a support level tested multiple times without a close below it, then monitor the resistance neckline as the entry trigger. A confirmed breakout above that level initiates a long position, with a stop-loss placed just below the most recent trough. The measured move target enables automated profit-taking, and the pattern's relatively long formation time often means the resulting breakout move is substantial.