Bullish Pennant
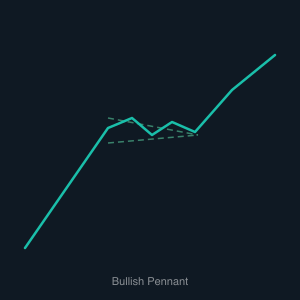
The Bullish Pennant pattern is closely related to the Bullish Flag but has a subtly different consolidation structure. It begins the same way — a sharp, near-vertical price spike that forms the flagpole — but instead of pulling back in a parallel channel, price consolidates in a small symmetrical triangle. This triangle is formed by a descending upper trendline connecting lower highs and a rising lower trendline connecting higher lows, causing the two lines to converge toward a point. The pattern typically forms quickly, reflecting a brief pause in momentum rather than a deep retracement.
The bullish resolution occurs when buyers propel price through the upper converging trendline. This breakout signals that the consolidation is complete and the prior uptrend is resuming. Just as with the Flag pattern, the measured target is calculated by taking the height of the flagpole and projecting it upward from the breakout level. The compressed, triangular structure of the pennant means the breakout often happens with a burst of volume, underscoring the renewed conviction among buyers and frequently leading to a fast, momentum-driven continuation move.
For algorithmic traders, the Bullish Pennant offers several measurable inputs that lend themselves to automation. A bot can be programmed to detect the initial spike, identify the converging trendlines of the pennant formation, and enter a long trade on a confirmed close above the upper trendline. Volume confirmation is particularly useful here — a breakout without a corresponding increase in volume is more likely to be a false signal. With a clear stop-loss below the pennant's lower trendline and a defined price target derived from the flagpole, bots can manage the entire trade with minimal ambiguity.