Double Bottom
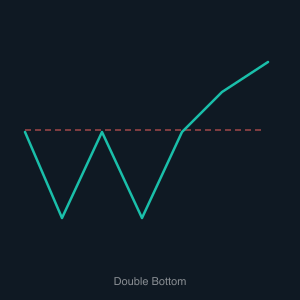
The Double Bottom chart pattern is used to identify a change in trend and a momentum reversal from prior bearish price action. It forms after a prolonged downtrend and is recognized by two distinct troughs set at approximately the same price level, separated by a moderate peak in between — creating a shape that closely resembles the letter W. The first trough represents an initial test of support where selling pressure overwhelms buyers, but the market then recovers to the interim high, known as the neckline. The second trough forms when price falls again to test the same support level, but this time sellers fail to push price lower, signaling that bearish momentum is exhausted.
The pattern is confirmed — and the bullish reversal signal is triggered — when price closes above the neckline formed by the peak between the two troughs. This breakout indicates that buyers have taken control and the prior downtrend is likely over. The measured target for the upward move is calculated by taking the distance from the support level to the neckline and projecting it upward from the breakout point. Volume behavior adds important context: ideally, volume is higher on the second trough's recovery and surges on the neckline breakout, confirming genuine buying conviction.
Bot traders value the Double Bottom for its clarity and its well-defined entry trigger. An automated system can track price action for two tests of a support zone, monitor the neckline as the confirmation level, and execute a long trade on a confirmed close above it. A stop-loss placed just below the second trough protects against false breakouts, while the measured move target provides a rational exit. Because the pattern is fundamentally about a failed retest of support, bots can also incorporate momentum indicators alongside price structure to improve signal quality and filter out weaker setups.