Double Top
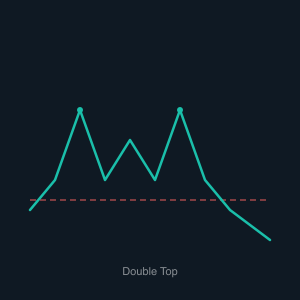
The Double Top chart pattern is one of the most widely recognized bearish reversal signals in technical analysis and is often looked to as an indicator of an intermediate or long-term price peak. It forms after a sustained uptrend when price reaches a resistance level, pulls back to form the neckline, and then rallies again to test approximately the same high. On the second attempt, bulls fail to break through resistance — the market makes roughly the same high as before but cannot push further. This repeated failure to advance signals that buying pressure is weakening and the uptrend may be losing its foundation.
The pattern is confirmed as bearish when price breaks below the neckline — the trough formed between the two peaks. At this point, the buyers who sustained the uptrend may capitulate en masse, and a bearish market typically follows. The measured downside target is the distance from the twin peaks to the neckline, projected downward from the breakdown level. Volume typically diminishes on the second peak relative to the first, a telling sign that the rally is losing momentum and that fewer participants are willing to buy at elevated prices.
For bot traders, the Double Top provides a clean and rule-based short entry. An automated strategy can identify the two peaks at similar price levels, calculate the neckline, and wait for a confirmed close below it before entering a short position. A stop-loss placed just above the second peak limits downside risk if the pattern fails. Because the Double Top is visible across all timeframes — from minute charts to weekly charts — bots can be tuned to monitor for it across multiple trading horizons simultaneously, making it a versatile component of an algorithmic trading strategy.