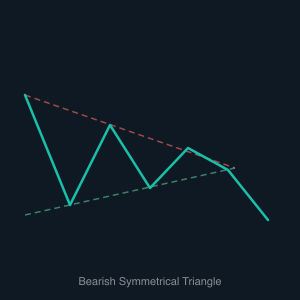
Bearish Symmetrical Triangle
The Bearish Symmetrical Triangle chart pattern shares the same visual structure as its bullish counterpart — two converging trendlines, one descending from a series of lower highs and one rising from a series of higher lows, squeezing price into an ever-narrowing range. The pattern is easy to spot on a chart due to this distinctive triangular compression. Volume typically decreases as the pattern matures, indicating that the market is coiling before a significant move. The key difference lies in context: when this pattern forms within a downtrend, the probabilities favor a bearish resolution.
Once price breaks decisively below the rising lower trendline, sellers take control and there is usually a very sharp price movement to the downside. This swift breakdown reflects the release of built-up selling pressure that had been suppressed during the consolidation phase. The measured downside target mirrors the breakout calculation used for bullish triangles — take the height of the triangle at its widest point and subtract it from the breakdown price. A high-volume candle closing below the support trendline is the strongest confirmation signal.
For bot traders, the Bearish Symmetrical Triangle offers a clean, rules-driven short setup. An automated strategy can track the converging trendlines, identify the lower boundary as the critical level, and trigger a short position when a candle closes below it with meaningful volume. Stop-losses can be set just above the upper trendline at the moment of breakdown, keeping risk tightly controlled. Because the pattern has a mathematically defined target, bots can also automate profit-taking at the measured move level, removing emotion from the trade entirely.