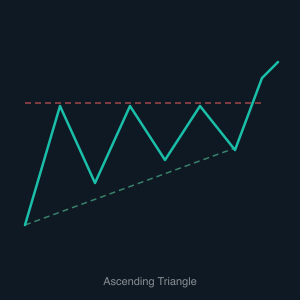
Ascending Triangle
The Ascending Triangle chart pattern appears during upward trends and is regarded as a continuation bullish pattern. It is formed by a flat horizontal resistance line along the top, connecting a series of roughly equal highs, and a rising trendline along the bottom, connecting a series of higher lows. This shape reflects a market where buyers are becoming increasingly aggressive — each pullback finds support at a higher level — while sellers defend a fixed price ceiling. The tension between these two forces compresses price action until one side gives way.
In most cases, buyers eventually break through the resistance line, triggering a strong upward move. The expected price target after the breakout is typically measured by taking the height of the triangle at its widest point and projecting that distance upward from the breakout level. While it most commonly acts as a continuation signal within an existing uptrend, it can also appear at the tail end of a downtrend as a reversal pattern, signaling that bears are losing control and bulls are beginning to take over.
For bot traders, the Ascending Triangle is a well-defined and rules-based setup that lends itself naturally to automation. A bot can be configured to monitor for the converging price structure and enter a long position on a confirmed candle close above the resistance line, with a stop-loss placed just below the most recent higher low. Volume confirmation — a spike on the breakout candle — adds further confidence. Because the pattern has clear geometric boundaries, it is one of the more reliable signals for algorithmic execution.