Bear Pennant
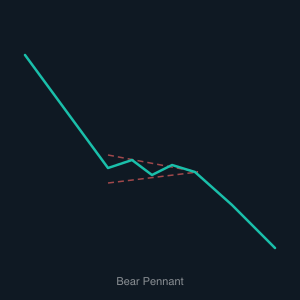
The Bear Pennant pattern begins with a sharp, rapid decline that establishes the flagpole — a near-vertical drop driven by strong selling pressure. Following this initial collapse, price enters a brief consolidation phase that forms the pennant itself: a small symmetrical triangle where each successive bounce reaches a lower high while each pullback holds at a higher low, creating a falling upper trendline and a rising lower trendline that converge toward an apex. This tightening structure reflects a temporary equilibrium between buyers attempting a recovery and sellers resisting any meaningful bounce. Volume contracts during the pennant formation, storing energy for the eventual breakdown.
The bearish signal is confirmed when the converging trendlines finally break to the downside. At this point, the compressed selling pressure is released and price typically moves sharply lower in what can become a continuation of the original decline. The measured target for the move is calculated by taking the height of the flagpole and subtracting it from the breakdown level, suggesting the next downward leg may mirror the initial drop in magnitude. This makes the Bear Pennant one of the more precise bearish continuation setups available to technical traders.
Algorithmic traders use the Bear Pennant as a reliable short-selling trigger because of its clearly defined geometry and measurable targets. A bot can monitor for the characteristic sharp decline followed by converging price action, then wait for a confirmed candle close below the lower trendline to enter a short position. Stop-losses can be placed just above the most recent lower high within the pennant structure. With both the entry condition and the profit target mathematically defined, the pattern is well-suited to fully automated execution with minimal discretionary input.