Bullish Flag
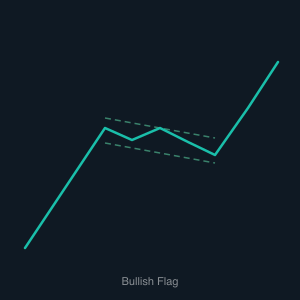
The Bullish Flag pattern begins with a powerful, near-vertical price surge — the flagpole — followed by a controlled pullback that forms the flag itself. During the pullback, price drifts lower in a channel defined by two parallel, slightly downward-sloping trendlines, with both lower highs and lower lows contained within those boundaries. This consolidation phase represents profit-taking and short-term hesitation rather than a true change in direction. Volume typically drops off during the flag formation, which is a healthy sign — it shows that selling pressure is light and the prior bullish momentum remains intact beneath the surface.
The signal to act comes when price closes back above the upper trendline of the flag. This breakout suggests that the buyers who drove the initial spike have regained control, and the market is ready to continue its upward trajectory. The target for the move is typically estimated by measuring the length of the flagpole and projecting that same distance upward from the breakout point. In a strong trend, the post-breakout move can be swift and decisive, mirroring the character of the original surge.
Bullish Flags are among the most popular patterns for both manual and algorithmic traders because they combine a clear entry trigger with a well-defined risk level. A trading bot can identify the flagpole, monitor the parallel channel, and execute a long trade the moment price breaches the upper trendline with confirming volume. The low point of the flag provides a natural stop-loss placement, and the measured flagpole target gives the bot a logical exit point — making the entire trade automatable from entry to exit.