Head & Shoulders
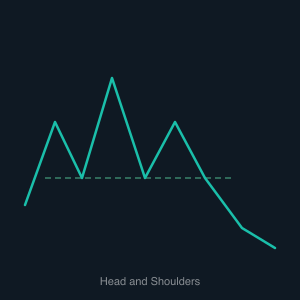
The Head & Shoulders chart pattern is one of the most famous and reliable reversal formations in technical analysis, named for its resemblance to a human silhouette. It consists of three successive peaks: a left shoulder, a higher central peak known as the head, and a right shoulder that reaches approximately the same height as the left. A neckline is drawn connecting the two troughs formed between the shoulders and the head, and this line acts as the critical support level for the pattern. The gradual decline in peak heights from head to right shoulder signals that buying momentum is waning with each rally attempt.
The pattern is confirmed as a bearish reversal when price breaks below the neckline after forming the right shoulder. This breakdown suggests that bulls have lost control and a shift from bullish to bearish trend is underway. The classic measured target is the distance from the head to the neckline, projected downward from the breakdown point — which can produce a substantial decline in trending markets. Volume tends to be highest on the left shoulder, lower on the head, and lower still on the right shoulder, reflecting the progressive loss of buying conviction that makes the eventual breakdown more reliable.
For bot traders, the Head & Shoulders pattern offers a structured, high-confidence short setup. An automated system can monitor for the three-peak structure and the neckline level, then trigger a short position on a confirmed close below that support line. A stop-loss placed above the right shoulder protects against false breakouts, while the measured target gives the bot a defined exit. Because the neckline can occasionally slope upward or downward rather than running flat, well-designed bots dynamically recalculate it based on the two connecting troughs rather than assuming a fixed horizontal level.