Backtesting
Backtesting
Backtesting runs your HaasScript against historical market data to see how the strategy would have performed. It is the fastest way to evaluate a script before committing capital or even running it on a simulated account. TradeServer Cloud includes backtesting directly in the script editor.
Where to Find Backtesting
Backtesting is available in the HaasScript Web Editor, accessible from the sidebar under HaasScript > Web Editor. When you have a script open, the quick-test and backtest widget buttons become available in the toolbar:

The widget can be opened as a floating window on top of the editor interface with three tabs: Execute, Result, and History.
The Execute Tab
The Execute tab is where you configure and start a backtest. It offers three modes for selecting the time window.
Length Mode
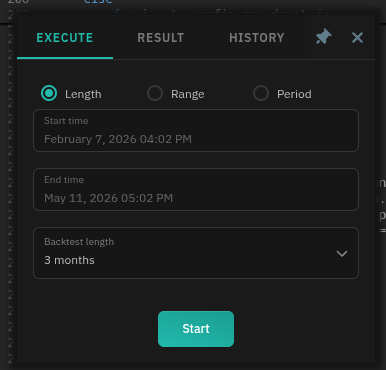
Choose a predefined lookback period. Select from the Backtest length dropdown:
- Common options: 1 day, 1 week, 1 month, 3 months, 6 months, 1 year
The Start time and End time fields update automatically based on your selection. For example, selecting "3 months" sets the end time to now and the start time to three months ago.
Use this mode when you want a quick test over a standard period without picking specific dates.
Range Mode
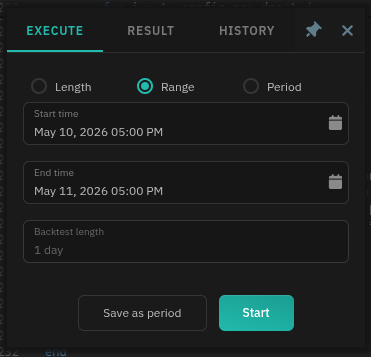
Manually set exact Start time and End time values. This gives you full control over the date range.
Use the Save as period button to store a custom range for reuse. Saved ranges appear in the Period mode dropdown.
Use this mode when you want to test how the script performed during a specific time window, such as a known bull run, a crash, or a sideways market.
Period Mode
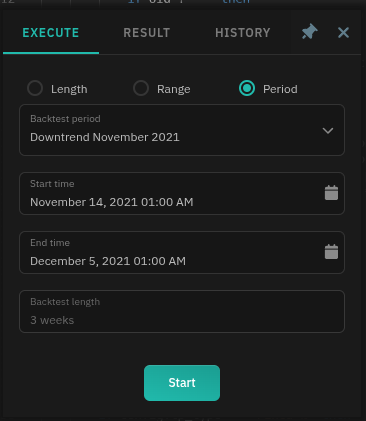
Select from saved or pre-configured date ranges in the Backtest period dropdown. TradeServer Cloud includes market-condition presets for uptrends, downtrends and sideways periods. Selecting a saved or pre-configured range will automatically populate the start and end times for a time period.
Use this mode to quickly test your script against specific market conditions without manually looking up dates, or to reuse ranges you saved from Range mode.
Starting the Backtest
Once your time period is selected, click the Start button. The backtest runs immediately and switches to the Result tab when complete. Depending on the date range and script complexity, this may take a few seconds to a minute.
Reading Results
The Result Tab
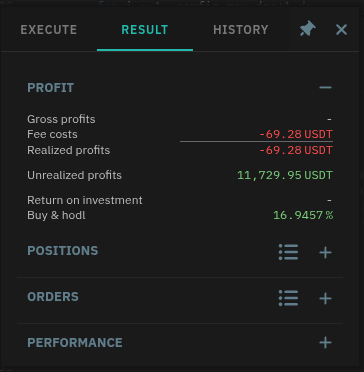
The Result tab shows aggregated metrics from the completed backtest. At the top, the Profit section gives an immediate summary:
| Metric | Description |
|---|---|
| Gross profits | Total profit before fees |
| Fee costs | Total exchange fees incurred (shown in red) |
| Realized profits | Net profit from closed positions |
| Unrealized profits | Floating profit on positions still open at the end of the period |
| Return on investment | Percentage return relative to capital deployed |
Below the profit section, three expandable sections provide deeper detail:
- Positions -- individual position records, including entry/exit prices, duration, and profit per trade
- Orders -- every order placed during the backtest, with status (filled, cancelled, etc.)
- Performance -- advanced metrics: Sharpe ratio, Sortino ratio, win percentage, profit factor, maximum drawdown, and more
Click the expand icon (+) next to each section to drill into the data.
Logs and Chart
Below the backtesting widget, the editor splits into multiple panels, such as:
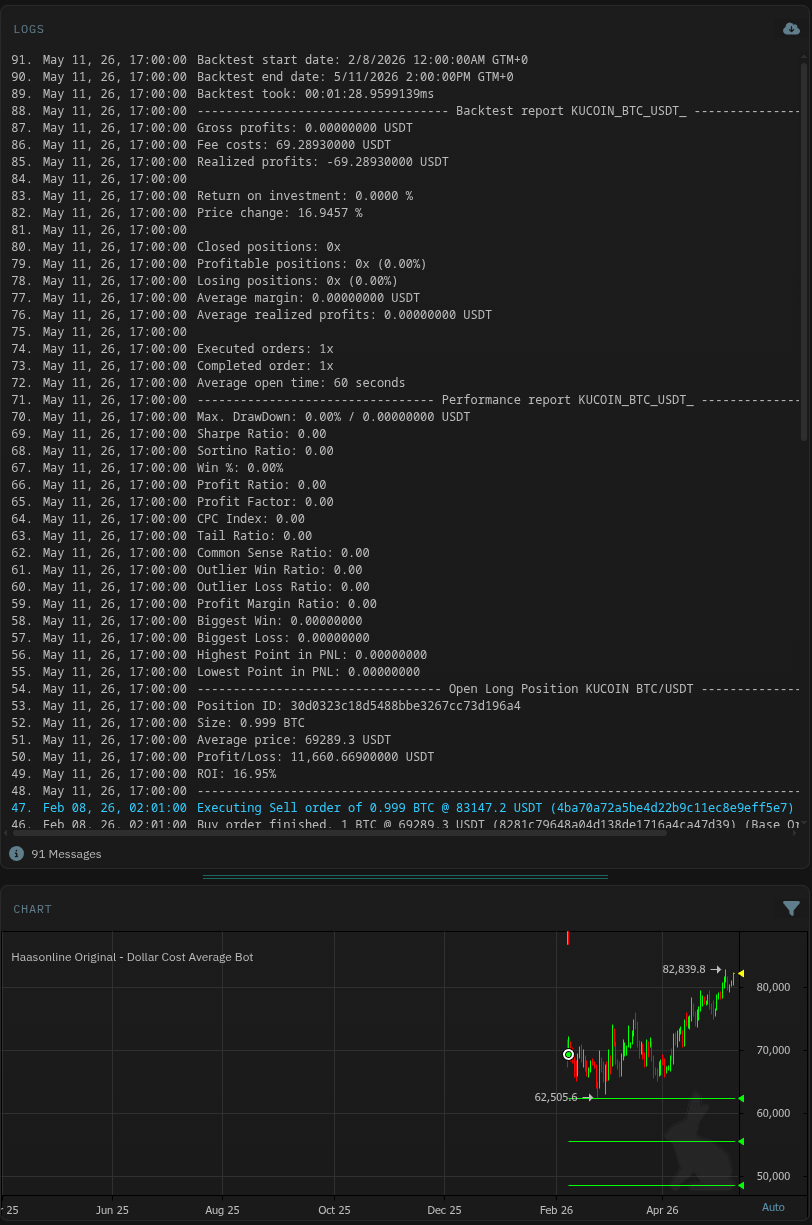
Logs -- A timestamped log of the entire backtest run. Each entry records what the script did at each interval:
- Backtest configuration (start/end dates, duration)
- Summary metrics (gross profits, fees, realized profits, ROI)
- Performance ratios (Sharpe, Sortino, Win %)
- Individual order executions with prices and amounts (e.g., "Executing Sell order of 0.999 BTC")
Scroll through the logs to understand exactly when and how the script placed orders, or to debug unexpected behavior.
Chart -- A candlestick chart of the market during the backtest period. Buy and sell points are overlaid as horizontal markers on the chart:
- Green markers indicate buy entries
- Red markers indicate sell exits
The chart lets you visually verify that entries and exits occurred where you expected, and that the script responded correctly to price action.
Backtest History
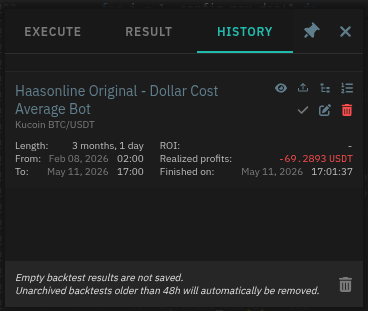
The History tab stores results from previous runs. Each completed backtest appears as a card showing:
- Script name
- Date range tested
- ROI (color-coded green for positive, red for negative)
- When the backtest finished
Each backtest card also have buttons to:
- View backtest results
- Load results to editor
- View position history
- View order history
- Preserve results
- Edit results tag
- Delete results
Some important details about history:
- Empty results are discarded -- if a backtest produced no trades, it is not saved
- Auto-cleanup -- unarchived backtests older than 48 hours are automatically removed
- Deletion -- use the red trash icon on any history card to delete that run manually, or delete all results from the grey trash icon at the bottom.
Reviewing your history is useful for comparing parameter changes across runs. If you want to preserve results beyond 48 hours, archive them or save the logs.
Tips for Effective Backtesting
Test across different market conditions. A strategy that looks great during a bull run may fall apart in a sideways market. Use the presets in Period mode to test against bull markets, bear markets, and consolidation ranges.
Watch the fee costs. A strategy with marginal profits can turn negative once fees are accounted for. The realized profit figure already includes fees -- use it as your true performance metric, not gross profits.
Compare against buy-and-hold. If your script's ROI is lower than what simply holding the asset would have returned, the strategy is underperforming the market.
Drill into the positions. Expand the Positions section and look for outlier trades -- a single massive win can mask a strategy that loses on most trades.
Iterate quickly. Use a short length (1 day, 1 week) for rapid parameter tweaking, then extend to longer periods once the strategy direction looks promising.