Price Tickers
Price Tickers
TradeServer Cloud includes a live price ticker bar at the bottom of the screen. This gives you at-a-glance pricing for markets you want to monitor without needing a full chart open.
The Ticker Bar
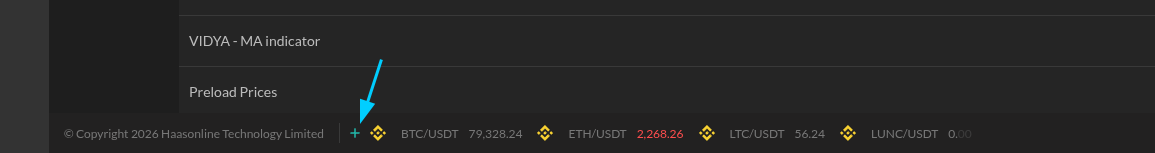
The footer ticker bar displays real-time prices for each market you've added. Each ticker item shows:
- The market pair (e.g., BTC/USDT)
- The current price
- Color-coded movement -- red text indicates a price decline, green incline.
To the left of the tickers is a + button for adding new tickers.
Adding a Ticker
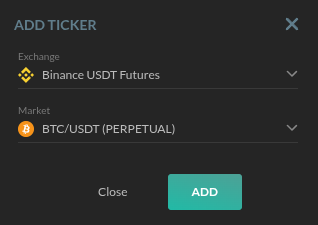
Click the + button on the ticker bar to open the Add Ticker modal.
- Exchange -- Select the exchange from the dropdown. The list includes all exchanges you have connected.
- Market -- Select the trading pair. Available markets update based on the exchange you selected.
- Click Add to add the ticker to your bar.
To remove a ticker, you can manage them from the ticker bar directly.
 ## Opening a Chart from a Ticker
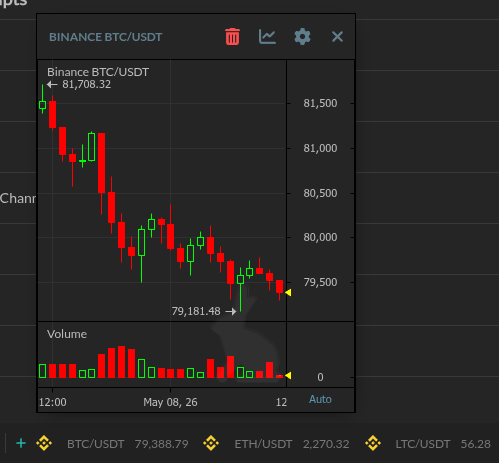
Each ticker can be expanded into a floating chart window. Clicking a ticker opens a candlestick chart for that market.
The chart window includes:
- Title bar -- Shows the exchange and market pair (e.g., "BINANCE BTC/USDT")
- Candlestick chart -- Green candles for upward movement, red for downward
- Volume bars -- Color-coded volume displayed below the main chart
- Price axis -- Price scale on the right side
- Time axis -- Timestamps along the bottom, with an Auto-scroll toggle
 ### Chart Window Controls
The title bar has several controls:
| Control | Function |
|---|---|
| Gear icon | Chart settings and configuration |
| Chart icon | Open the chart in Market View |
| Trash can | Delete the ticker |
| X | Close the chart |
The chart windows float independently, so you can position them wherever you want on screen and open multiple charts simultaneously.